Exhibition Report: Marketing Technology Fair Tokyo 2023
Exhibited at “Marketing Technology Fair Tokyo 2023 (11th)” on February 9 (Thu) and 10 (Fri), 2023 at Tokyo Big Sight
We exhibited at the Marketing Technology Fair Tokyo 2023 (11th) held at Tokyo Big Sight on February 9 (Thu) and 10 (Fri), 2023, from 10:00 AM to 5:00 PM.
We sincerely thank the many visitors who stopped by our booth.
At FLOURISH, we aim to collaborate with clients who are striving to make society better—especially in the fields of marketing × technology × creativity—so that they can achieve their missions.
Here’s a report on our exhibition at the event.
Booth Overview
We showcased four main topics:
- Marketing: A demonstration of our Marketing Diagnostic Tool
- Web Development: Good UI vs. Bad UI comparison
- Creative/Branding: Elements that build branding
- Data Science: Data analysis with the theme of non-alcoholic beverages
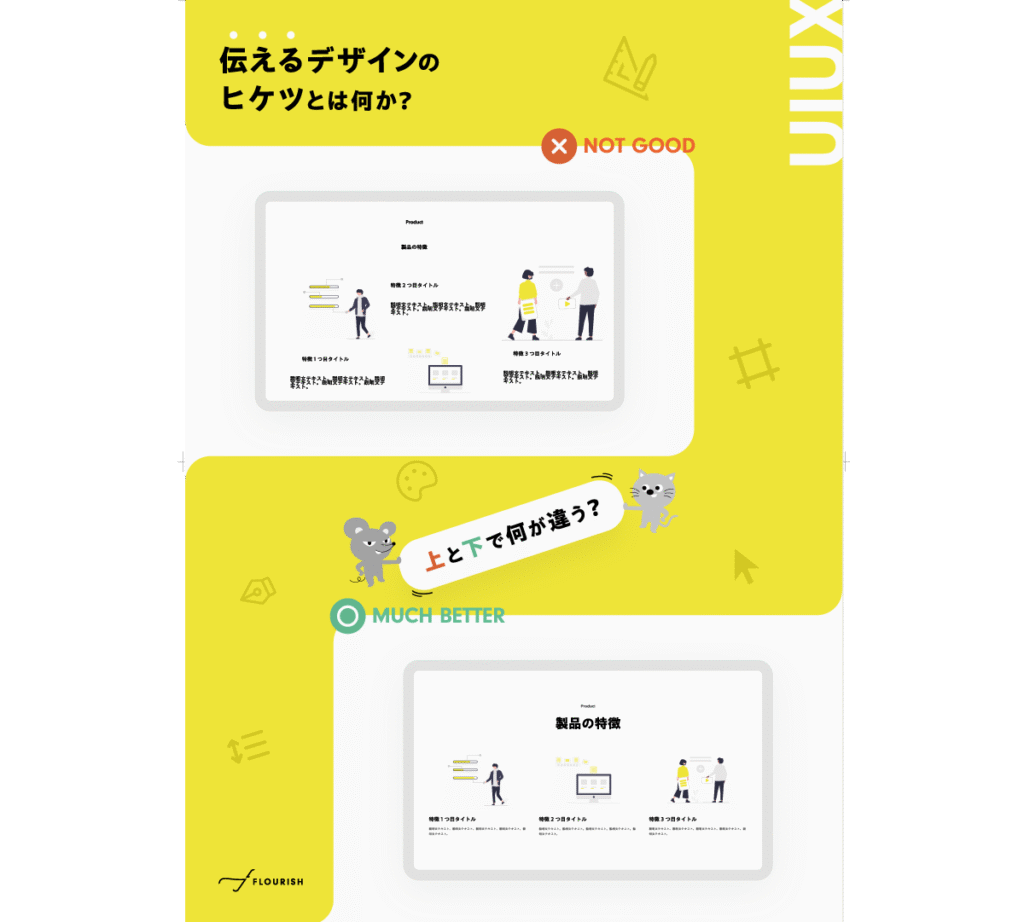
Web Development: Good UI vs. Bad UI
What’s the secret to effective design?
Poor first impressions like “hard to use,” “unclear messaging,” “not sure what this company does,” or “felt untrustworthy” can easily cause users to lose trust.
To help visitors experience what makes for effective design, we showcased examples of Good UI and Bad UI side by side.
UI/UX Panel Example
Sometimes, you commission a design and end up thinking: “Something feels off…”
Knowing what defines Good UI is very useful in those situations.
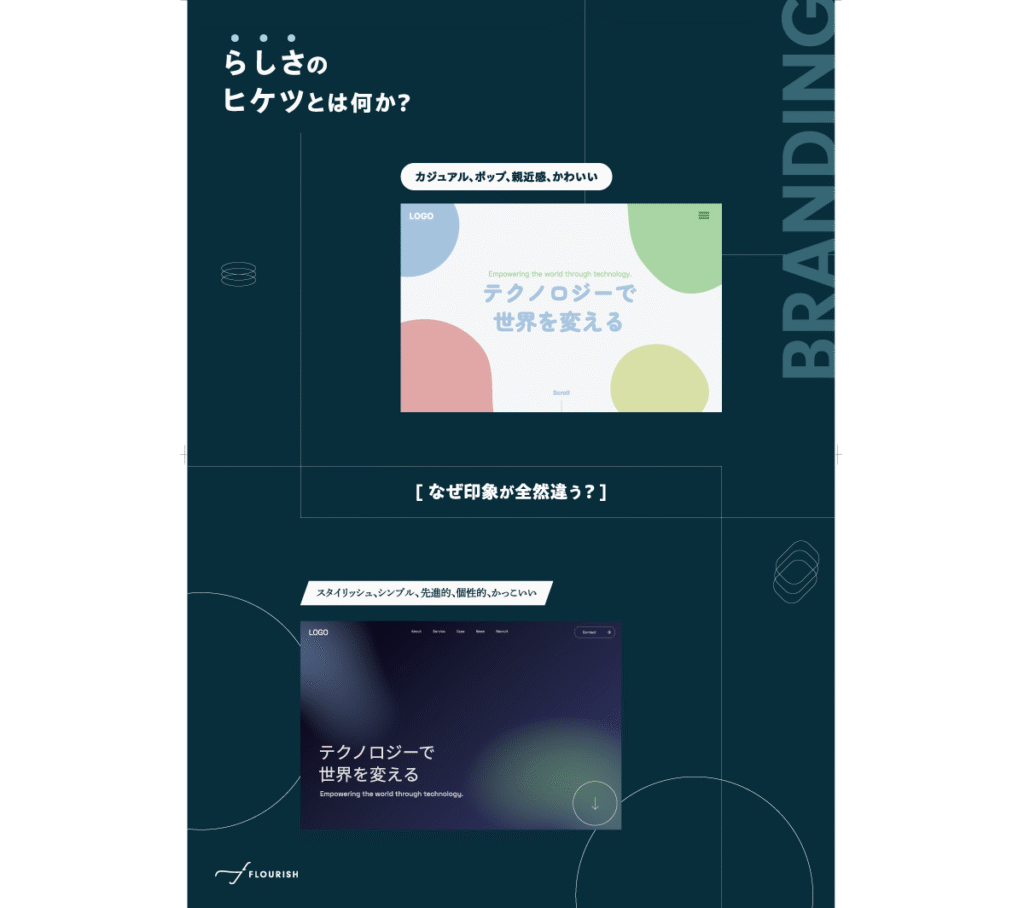
Creative: Branding Elements
What makes a brand feel authentic?
We showcased two web designs using the same copy, yet giving completely different impressions.
We explained where that difference comes from.
Brand equity refers to the intangible assets associated with a brand—its name, logo, and symbolism—and how these can increase the value and appeal of products or services.
To enhance brand equity, companies need to manage communication channels and touchpoints in a unified way.
Data Science: Non-Alcoholic Beverage Analysis
We presented a data science quiz:
Visitors had to choose which of two trend lines more accurately predicted non-alcoholic beverage sales.
This was designed to let visitors experience how different analysis methods (chosen by analysts) can lead to different interpretations—and what it means to draw credible insights.
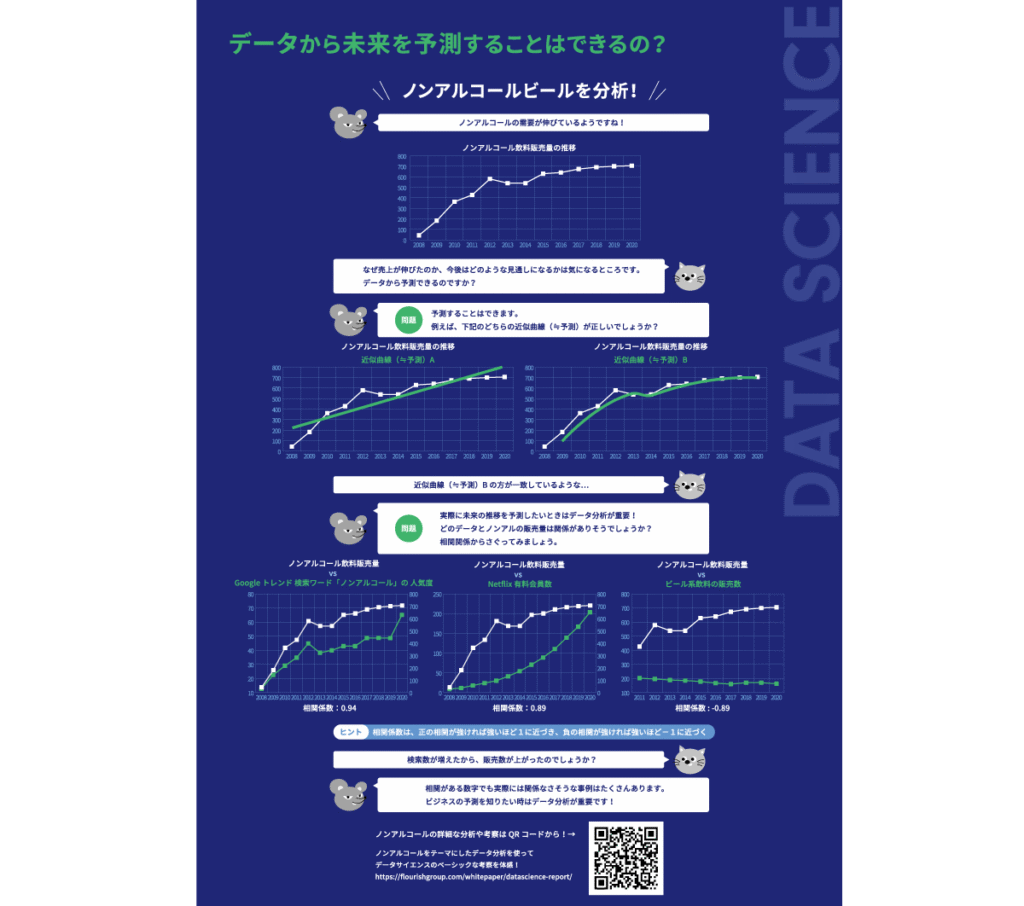
Data Science Panel Example
We further analyzed the correlation between non-alcoholic beverage sales and the following data:
- Google Trends: Popularity of the keyword “non-alcoholic”
- Number of paid Netflix subscribers
- Sales volume of beer-related beverages
This served as a great example of how seemingly correlated data may hide pitfalls and lead to incorrect assumptions.
Marketing: Marketing Diagnostic Tool
As part of our Marketing Management and Strategic Support Services, we offer marketing support to clients.
Using our proprietary FLOURISH Marketing Suite, we provide consulting services.
At this event, we showcased a lightweight version of the Marketing Suite: a fun, fortune-telling-style Marketing Diagnostic Tool, available for free and built specifically for the event.
In Closing
This was our very first time exhibiting at a trade show, and we are truly grateful for the opportunity to engage directly with so many professionals and companies.
We sincerely appreciate everyone who took the time to visit our booth.